

TL;DR
- Define observability for AI as signals about data, model behavior, and runtime to detect silent failures quickly.
- Track core KPI categories: accuracy, throughput, latency, cost, business impact, and safety with concrete thresholds and SLOs.
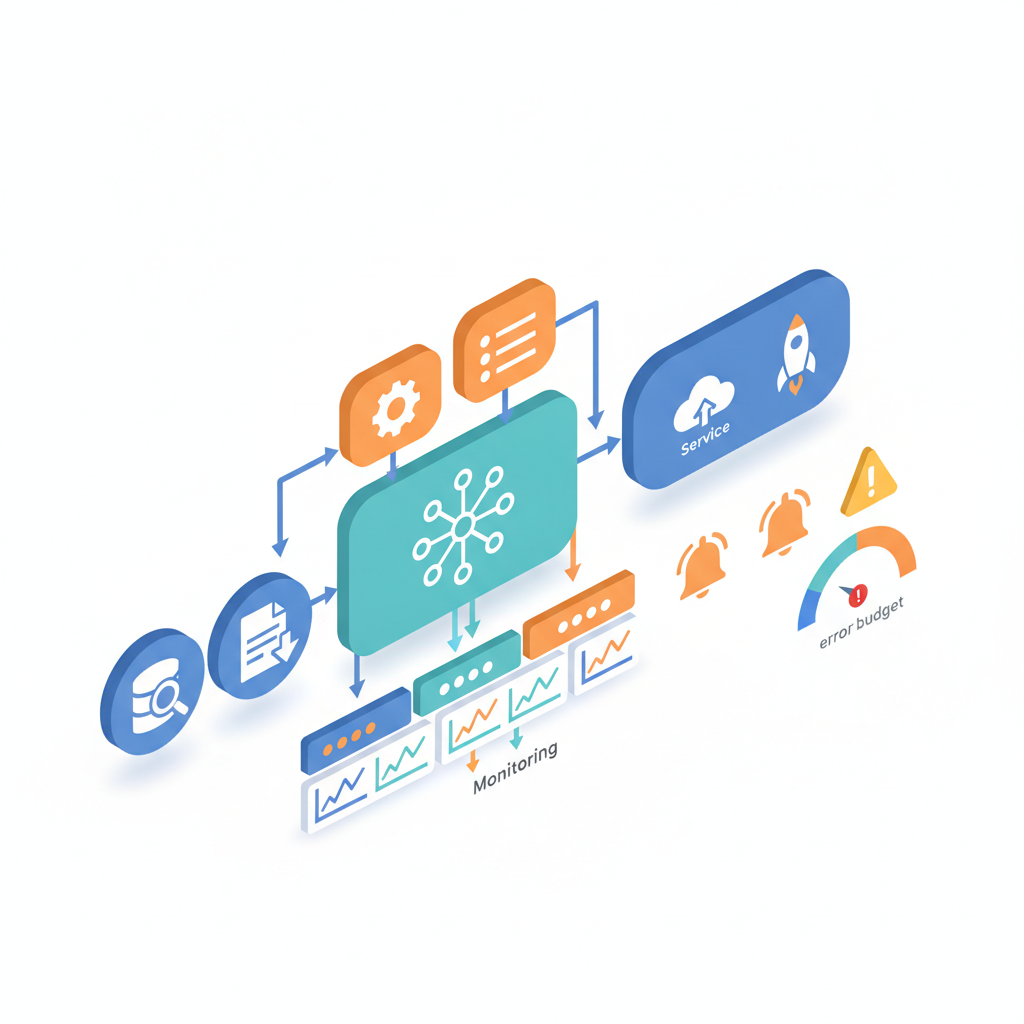
- Design separate dashboards for engineers, operators, and executives; include automated alerts and error budgets for graceful rollbacks.
- Monitor data quality (drift, label quality, upstream failures) and integrate human-in-the-loop feedback into operational metrics.

Introduction: observability is the set of signals that let you infer the internal state of an AI system from its outputs and telemetry. For AI process automation pilots, observability covers model predictions, data schemas, request/response traces, and business outcomes. This guide walks you through observability ai process automation pilots with sample SLOs (for example: for a typical SaaS flow, target 95th percentile latency < 300 ms in-region; target true positive rate > 90% on validated segments) and region-aware notes (EU: minimize raw logging and store only hashed identifiers to reduce GDPR risk; APAC: monitor regional latency zones separately). You’ll get checklists, dashboards, thresholds, and playbook snippets you can copy into your project plan.
Who this is NOT for
This guidance does not apply when you cannot evaluate outputs objectively, when labels or business outcomes don’t exist, or when the automation is exploratory and never intended to run on live traffic. Do not use these production thresholds for one-off research experiments, for models that transform proprietary data you cannot log, or where legal constraints forbid telemetry capture. If your pilot processes fewer than a handful of events per day and human review is permanent, a full observability stack will add overhead without benefit.
Why observability matters for AI automation (differences from traditional app monitoring)
Observability for AI differs from traditional app monitoring because model-driven failures are often silent: accuracy drifts slowly while latency and CPU look fine. In ai process automation monitoring you must add data and label signals to the usual uptime, error, and latency metrics. For example, a business rule automation might return valid HTTP status codes but produce incorrect downstream operations because the model misclassified a key entity. Standard APM would miss that; observability ai process automation pilots must capture prediction confidence, feature distributions, and sketch-ground truth comparisons.
Practical example: a marketer runs an automation to tag incoming lead messages. Traditional monitoring shows 99.9% uptime, but conversion falls. Observability surfaces a rise in false positives for the “high-intent” tag and flags feature drift after an ad campaign change. That insight lets the team roll back the tag or add a validation gate.
Quotable: "Monitoring model outputs is necessary to turn silent model decay into actionable alerts."
Core KPI categories: accuracy, throughput, latency, cost, business impact, and safety
Frame KPIs into six categories so stakeholders speak the same language: accuracy (quality of predictions), throughput (requests per second or items processed per hour), latency (P50/P95 response times), cost (per-call or hourly infrastructure cost), business impact (revenue, conversion, time saved), and safety (high-risk misclassifications, toxic outputs). For observability in AI process automation pilots, it's essential to map each category to a concrete metric and an owner, as outlined in our 90-day pilot-to-production playbook.
Example KPIs you can copy: accuracy = true positive rate on a rolling 7-day labeled sample; throughput = daily completed workflows; latency = P95 end-to-end response time by region; cost = average cost per request; business impact = weekly revenue attributed to automation; safety = count of safety violations per 10k requests. Assign owners: data science owns accuracy, SRE owns latency/cost, product owns business impact and safety.
Principle: A KPI without an owner is an alert that no one will act on.
Example metrics and how to measure them (true positive rate, false positive rate, MTTR)
Translate KPI categories into measurable metrics. Use true positive rate (TPR) and false positive rate (FPR) for classification; precision/recall for multi-class tasks; mean time to recover (MTTR) and mean time between failures (MTBF) for operational resilience. Measure TPR/FPR on a labeled validation stream (not training data) and compute rolling windows (24h, 7d) to catch drift.
Measurement steps: 1) instrument your inference pipeline to emit prediction, confidence, input hash, and a lightweight context ID; 2) sample 1-5% of requests for human labeling or use an offline rubric to estimate label quality; 3) compute TPR/FPR on that sample and publish to dashboards daily; 4) calculate MTTR as time from alert to either rollback or fix deployment. Example decision rule: if TPR drops >5 percentage points versus baseline AND FPR increases by 3 points in 24 hours, trigger a manual review and throttle automated actions.
Designing dashboards: what to show for engineers, operators, and executives
Design three dashboard views with tailored signals. Engineers need raw traces, feature distributions, prediction examples, and recent failed cases. Operators want availability, latency by region, throughput, and error budgets. Executives need high-level business impact: conversion lift, cost per action, and safety incidents. Keep each dashboard focused—don’t overload the exec view with raw logs.
Dashboard example contents by role: engineers: live sample stream, feature drift heatmaps, label backlog; operators: P95 latency per region, current error budget burn rate, pipeline queue length; executives: weekly ROI, customer-facing incident count, automation-enabled revenue. Use filters for region and model version. For ai pilot metrics and dashboards, ensure each view links to the incident playbook and the human review queue.
Error budgets & SLOs for AI models and pipelines
Error budgets and SLOs give a pragmatic way to accept measured risk. Define SLOs per critical endpoint: e.g., SLO: 99% of automated tagging actions must have confidence > 0.85 and pass post-hoc sampling checks. Then define an error budget (1% margin) that when exhausted triggers mitigation: roll back the model, reduce automation to manual review, or throttle traffic. Treat model degradation as a capacity problem: error budget exhaustion forces a stopgap while teams fix root causes.
Example: set a 30-day SLO for business-impacting predictions (95% precision) and a 7-day SLO for latency (P95 < 300 ms in-region). Use error budgets for ai automation to decide whether to continue testing or pull back to manual gates. Document the escalation path: owner notification, customer-impact assessment, and rollback window.
How to set thresholds and automated alerts
Set thresholds using historical baselines plus safety margins. Begin with three zones: green (within baseline), yellow (deviation exceeds alert threshold), red (breach). Use anomaly detection for patterns rather than fixed thresholds where appropriate. Automate alerts for yellow (paged to on-call) and red (automatic mitigation such as throttle or rollback).
Mini table of recommended alert thresholds:
| Signal | Yellow threshold | Red threshold |
|---|---|---|
| P95 latency (region) | ||
| True positive rate | ||
| Label backlog |
Use automated playbooks: a yellow alert notifies the owner and increases sampling; a red alert activates rollback and stop-the-line controls. For ai process automation monitoring, prefer multi-signal alerts (latency + error type + drift) to reduce noise.
Data quality signals to monitor (drift, label quality, upstream failures)
Track feature drift (statistical shifts), label quality (agreement rates and annotator drift), schema violations, and upstream system failures. Instrument feature histograms, PSI (population stability index) on numeric features, and mismatch counters for missing keys. Upstream failures often look like sudden spikes in null values or truncated payloads; correlate those with model quality drops.
Concrete example: when the PSI for a key numeric feature exceeds 0.25 over 7 days, add the traffic to a holdout bucket and raise a data-quality incident. Monitor label quality by tracking inter-annotator agreement; if agreement drops below 80% on a sampled set, pause automated actions dependent on those labels.
Principle: Data drift is the most common root cause of model failure in pilots.
Integrating human-in-the-loop metrics and feedback loops
Human-in-the-loop (HITL) is essential during pilots. Track human review rate, correction rate, time to review, and feedback incorporation latency (how long till human labels retrain the model). Use these metrics in your operational dashboards and to plan retraining cadence.
Example workflow: route low-confidence predictions (confidence < 0.6) to a review queue; measure correction rate and use corrected samples to create an incremental training set. Operational metrics for ai systems should include the percent of decisions needing human review and the percent of human overrides—those numbers tell you when to retrain or loosen/tighten automation.
Tooling recommendations and checklist for instrumentation
Use a combination of observability tools: distributed tracing for request flows, a metric store for time-series, a feature store or snapshotting layer for input distributions, and a lightweight labeling pipeline. Don’t try to build everything in-house; integrate well-known tooling where possible and instrument consistently across branches and model versions.
- Instrument prediction events with: request id, model version, inputs hash, outputs, confidence, region.
- Stream samples to a labeling queue (1–5% sampling) and store label metadata.
- Emit feature histograms hourly and compute drift metrics daily.
- Expose SLO burn rates and error budget dashboards to operators.
Example observability runbook and incident playbook snippets
Runbook snippet: When error budget < 25% remaining in 24 hours, do: 1) Page data science and SRE, 2) Increase sampling to 10% for 2 hours, 3) If TPR drop > 7 points, rollback to previous model, 4) Open an RCA ticket and block deployments until resolved.
Incident playbook snippet: For safety violation detected in production: 1) Mark affected outputs and notify legal/product, 2) Switch to manual review for affected customer segments, 3) Quarantine the model version, 4) Begin expedited labeling of affected cases for retrain or patch.
FAQ
What is observability & kpi framework for ai process automation pilots?
Observability ai process automation pilots is a framework of telemetry, KPIs, sampling, and playbooks that lets teams detect, diagnose, and act on model and data failures during a pilot stage.
How does observability & kpi framework for ai process automation pilots work?
The framework collects prediction, feature, label, and infrastructure signals; computes operational metrics and SLOs; applies error budgets for risk decisions; and connects automated alerts to human review and mitigation playbooks.