
Why forecasting ROI matters when you scale after a pilot
What is an ai process automation roi model and why should you forecast it before scaling? An ai process automation roi model is a repeatable calculation that converts operational changes (hours saved, fewer errors, extra throughput) into dollars and months-to-payback; you must forecast it early so finance, procurement, and engineering share a single, testable expectation.
Scaling is defined here as either 3x your pilot processes or more than 10 automated workflows; typical payback windows range from 3–12 months depending on use case. Forecasting before scale avoids three common failures: under-budgeted operations, missed integration costs, and mis-set KPIs that make a successful pilot look like failure at scale. For example, if a content tagging pilot on a publishing site reduces manual tagging time by half, forecasting identifies whether the saving funds expanded automation, headcount reallocation, or reinvestment in model monitoring.
Use this section to align stakeholders on expected outcomes, the timeframe for realizing value, and the core inputs you’ll track during rollout. A clear forecast makes procurement comfortable approving vendor contracts and gives engineering guardrails for acceptable run-rate costs.
Define scope & baseline — what ‘scaling’ means (processes, users, volume)
Define scope with concrete thresholds: number of processes, number of users, and transaction volume. For forecasting, treat scaling as either a 3x increase of pilot processes or exceeding 10 automated workflows; document which applies to your program. Baseline the state before automation: active FTEs handling the process, average cycle time, current throughput, and error rates.
Example: a marketing operations pilot automates approval routing for 2 campaigns daily. Scaling could mean automating 6 campaigns daily (3x) or adding creative and legal approval flows until the program covers 12 workflows (>10). Capture the baseline for each workflow: daily items, average minutes per item, rework rate, and revenue-influence per processed item.
Make these artifacts: a scope matrix listing workflows, owners, and volume buckets; and a baseline snapshot table you can update monthly as you scale. These artifacts keep the forecast honest when reality shifts.
Core metrics to capture before you scale (FTE hours, cycle time, error rate, throughput, revenue enablement)
Track the same metrics in pilot and scale phases so you can compare apples to apples. Minimum required metrics: FTE hours per process, average cycle time per item, error/rework rate, throughput (items/day), and any revenue enablement metric (conversion lift or time-to-revenue improvement). Record the fully-loaded cost per FTE and any incremental revenue tied to faster processing.
Concrete example KPIs: target P95 cycle time under 2 minutes for automated steps; error rate below 1% for billing reconciliation workflows; throughput target 5,000 items/month. For website owners, include page-level metrics such as time-to-publish or content lead time that automation reduces.
Collect raw logs and a small analytics dashboard with these fields: process name, date, items processed, manual hours, automated hours, errors, and incremental revenue. These fields feed every ROI model below and support credible changes during the scaling decision gates.
Three practical ROI models
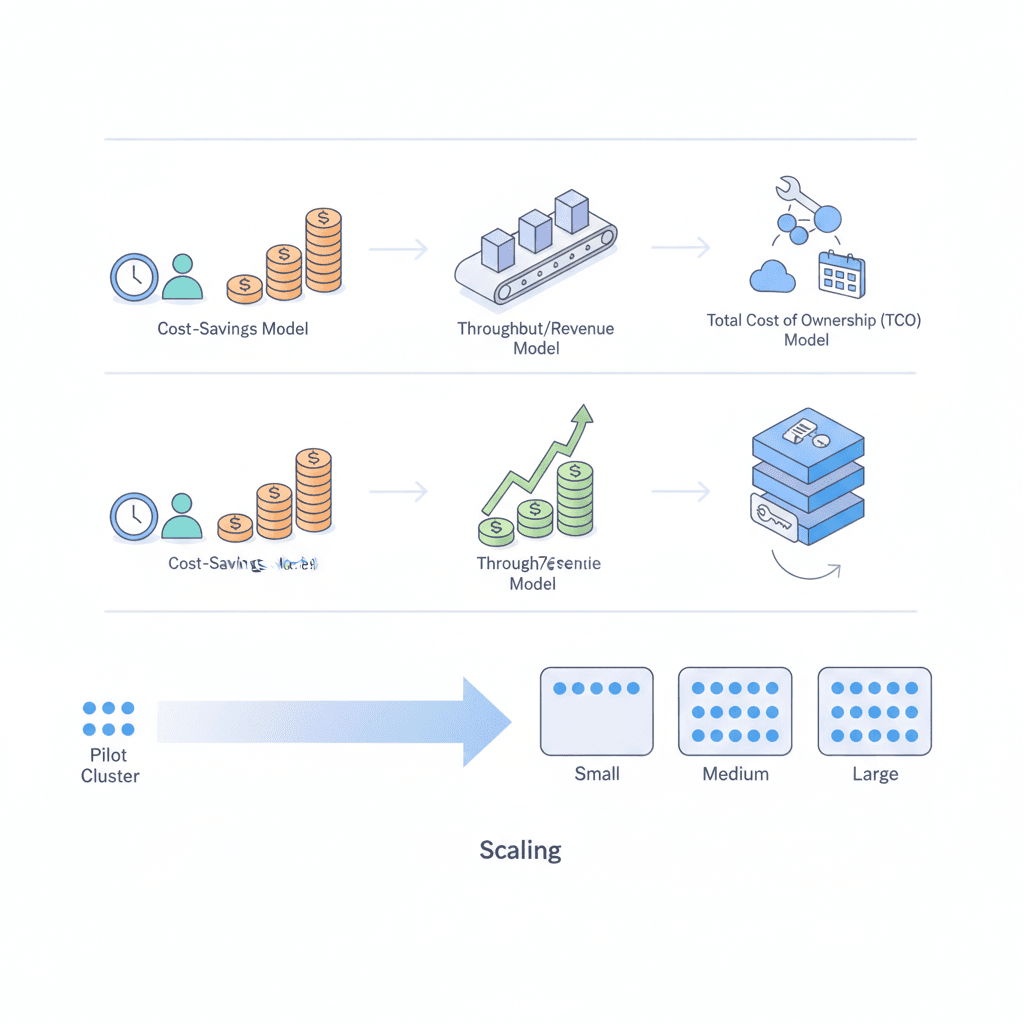
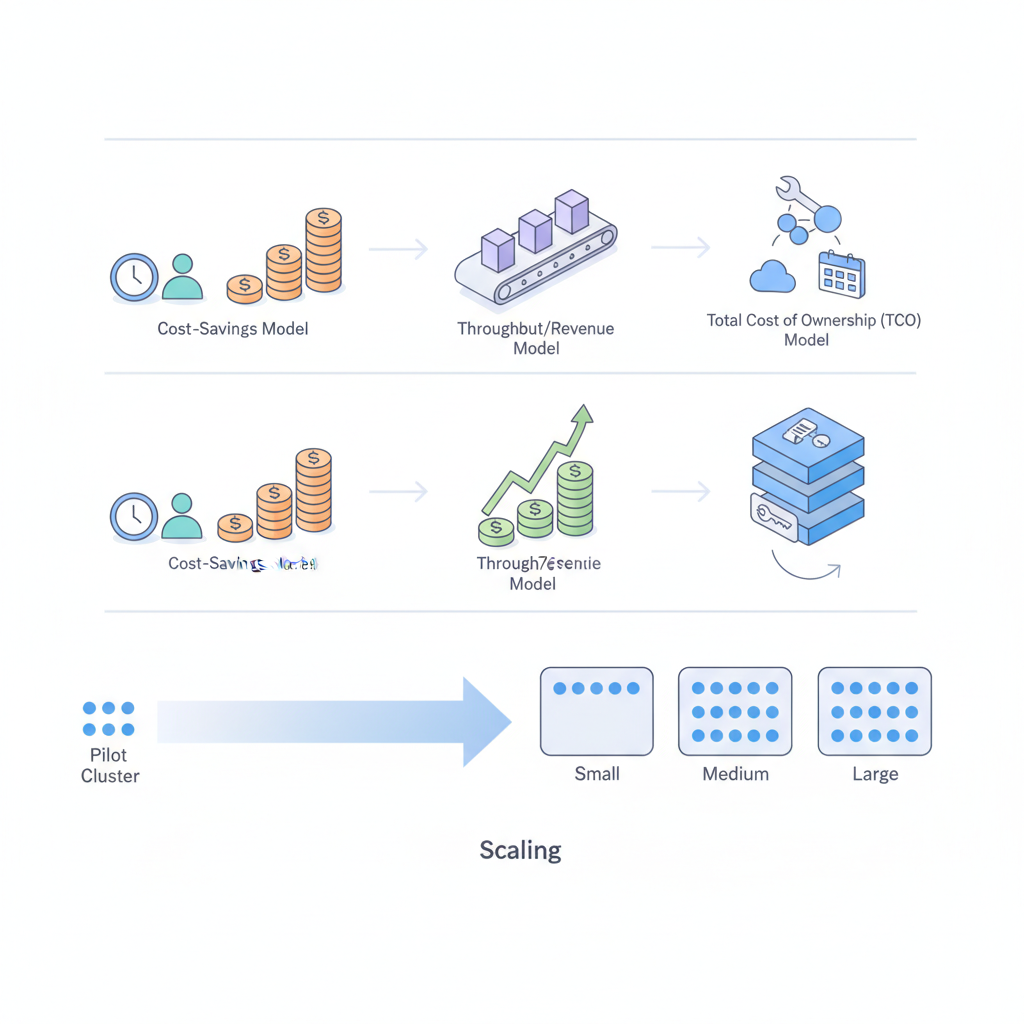
A practical forecasting approach uses three models together: cost-savings, throughput/revenue enablement, and total-cost-of-ownership. Use each to answer different stakeholder questions: HR and finance ask the cost-savings question, sales/marketing ask the revenue enablement question, and engineering asks the TCO question.
Keep the models simple and auditable: use spreadsheet tabs named CostSavings, RevenueEnablement, and TCO. Each model should reference the same baseline inputs so differences come from assumptions, not mismatched data.
An ROI model without reconciled baseline hours is a forecast that will be rejected by finance.

Cost-savings model (hours saved × fully-loaded cost)
The cost-savings model multiplies hours saved by the fully-loaded hourly cost of the FTEs those hours come from. Include burden (benefits, overhead) in the fully-loaded number and track whether those hours are redeployed or removed—savings differ if headcount is repurposed versus reduced.
Example calculation: pilot shows 200 manual hours saved per month. At a US fully-loaded FTE rate of $90,000/year (~$43/hr), the monthly savings equal 200 × $43 = $8,600. When scaling to 3x volume, the model projects 600 hours saved and $25,800 monthly savings. Use this model to justify immediate operational savings and to compute the ai automation payback period for your licensing and integration costs.
Throughput/revenue enablement model (incremental revenue per process unit)
This model values each additional process unit (e.g., order, lead, published article) by its incremental revenue. Calculate revenue per unit and multiply by expected increase in processed units after automation. Conservative forecasts assume no change in conversion; aggressive forecasts assume improved conversion due to faster or more accurate processing.
For a site monetizing via ads, automation that shortens publication time can increase impressions; estimate incremental impressions per article and convert to revenue per impression. Use three scenarios—conservative (-10% uplift), expected (+30%), aggressive (+60%)—and show break-even months for each scenario.
Total-cost-of-ownership model (licensing, infra, integration, ops)
TCO aggregates all recurring and one-time costs: vendor licensing, cloud inference or data costs, integration engineering, testing, monitoring, and ongoing ops/support. Include amortized integration costs and a runbook cost for on-call operations.
Example line items: annual license, monthly inference spend, one-time integration contractor fees, internal engineering hours for monitoring (monthly), and incident remediation. Sum these, then divide by monthly savings (cost-savings + revenue enablement) to compute the ai automation payback period. Present both monthly and annualized views so finance can approve budget windows appropriately.
Worked example: 3 scenarios (conservative / expected / aggressive) with numbers
Use the same baseline and apply three uplift scenarios to both cost-savings and revenue models. Example baseline: pilot saves 200 hours/month, incremental revenue per unit is $15, and integration cost is $45,000 one-time with $2,500/month ops. Scenarios change the effective uplift on hours and revenue:
- Conservative: -10% from pilot (i.e., 180 hours/month)
- Expected: +30% (260 hours/month)
- Aggressive: +60% (320 hours/month)
Compute monthly net value = (hours × fully-loaded rate) + (incremental units × revenue) - monthly TCO. Then show break-even months by dividing one-time costs by monthly net value for each scenario. Present these in a simple table in your spreadsheet for procurement to review.
Use three scenarios—conservative (-10% uplift), expected (+30%), aggressive (+60%)—and show break-even months.
Inputs, assumptions and calculation steps
List raw inputs: baseline hours, items/month, fully-loaded FTE cost, incremental revenue per item, one-time integration cost, recurring ops cost, and expected uplift. Calculation steps: 1) normalize units, 2) apply uplift, 3) compute monthly savings and revenue, 4) subtract monthly TCO, 5) compute payback months.
Quotable: "Normalize units first; inconsistent baselines create phantom ROI." Keep assumptions transparent in a assumptions tab so stakeholders can tweak numbers during sensitivity analysis.
Sensitivity & break-even analysis — how assumptions change the story
Sensitivity analysis varies one assumption at a time to show impact on payback. Common levers: fully-loaded FTE cost, uplift percentage, and cloud inference price. Present tornado charts or a simple table that lists payback months when each input varies ±20%.
Example: if your fully-loaded FTE cost is uncertain, show payback at $80k, $100k, and $120k. For forecast ai automation roi conversations, sensitivity quickly shows whether your program survives realistic vendor price increases or lower-than-expected process uplift.
Data requirements and quick templates (spreadsheet model + reporting dashboard fields)
Required fields: process_id, process_name, baseline_items_per_month, baseline_hours_per_item, pilot_hours_saved_per_item, fully_loaded_hourly_cost, incremental_revenue_per_item, one_time_integration_cost, monthly_ops_cost. Use these fields across all model tabs.
Recommended baseline FTE costs (placeholders):
| Region | Conservative annual FTE |
|---|---|
| US | $80,000–$120,000 |
| EU | €50,000–€80,000 |
Five-line spreadsheet template (copy/paste into a sheet):
process_name,baseline_items,baseline_hours_per_item,pilot_hours_saved_per_item,fully_loaded_hourly_cost
Email triage,1000,0.5,0.25,45
Invoice processing,3000,2.0,1.0,55
Content tagging,500,0.75,0.40,43
Common pitfalls and how to avoid optimistic bias
Pitfalls: using pilot metrics that are not representative, ignoring integration cost, and double-counting savings across models. Avoid optimistic bias by requiring at least one external validation: peer benchmarks, vendor TEI, or an independent audit of baseline hours. For example, reconcile pilot timestamps with server logs to verify claimed time savings.
Actionable guardrails: require P95 latency targets for automation steps, validate error-rate changes via A/B testing, and cap revenue uplift assumptions to a conservative percentile unless you have A/B evidence.
Decision gates and timeline for scaling investments (30/60/90 / 6-12 month checkpoints)
Use staged gates: 30-day (pilot stability), 60-day (integration readiness), 90-day (operational run-rate), and 6–12 month (business value confirmation). Each gate has deliverables: updated KPI dashboard, cost reforecast, incident log, and stakeholder sign-off.
- 30 days: confirm pilot metrics with raw logs
- 60 days: finalize integration plan and staffing
- 90 days: validate automation under production load
- 6–12 months: confirm payback and decide on further scale
How to present ROI to procurement and finance (slide checklist)
Slide checklist: 1) one-slide summary with payback months under three scenarios; 2) baseline and assumptions tab; 3) TCO with amortized integration; 4) sensitivity table; 5) runbook and ops cost; 6) timeline with gates and owner names. Keep slides simple: a CFO needs the single number (payback months) and the sensitivity table behind it.
Conclusion — checklist and next steps
Checklist: document baseline, choose the three ROI models, run three scenarios, perform sensitivity analysis, and schedule gate reviews at 30/60/90 days and 6–12 months. Next steps: populate the spreadsheet template, run the cost-savings and revenue enablement tabs, and review results with procurement.
Quotable: "Calculate roi for ai automation with transparent inputs and three scenarios before you request scale budget." Use forecast ai automation roi to set expectations and avoid costly mid-rollout changes.
References
- Forrester — TEI methodologies
- Forrester — The Total Economic Impact of process intelligence
- McKinsey — Gen AI’s ROI summary
- Microsoft Power Platform guidance
FAQ
What is forecasting roi when scaling ai process automation?
An ai process automation roi model is a structured calculation that converts operational changes into financial terms and estimates months-to-payback using cost-savings, revenue enablement, and total-cost-of-ownership views.
How does forecasting roi when scaling ai process automation work?
Forecasting works by establishing a baseline, choosing scenario uplifts, running the three ROI models, and performing sensitivity and break-even analysis to determine payback months and funding readiness.