
The importance of operational reliability when choosing AI APIs
Are you evaluating AI APIs and wondering which provider will keep your site running smoothly? An operational reliability score quickly separates vendors that are production-ready from those fit only for prototypes.
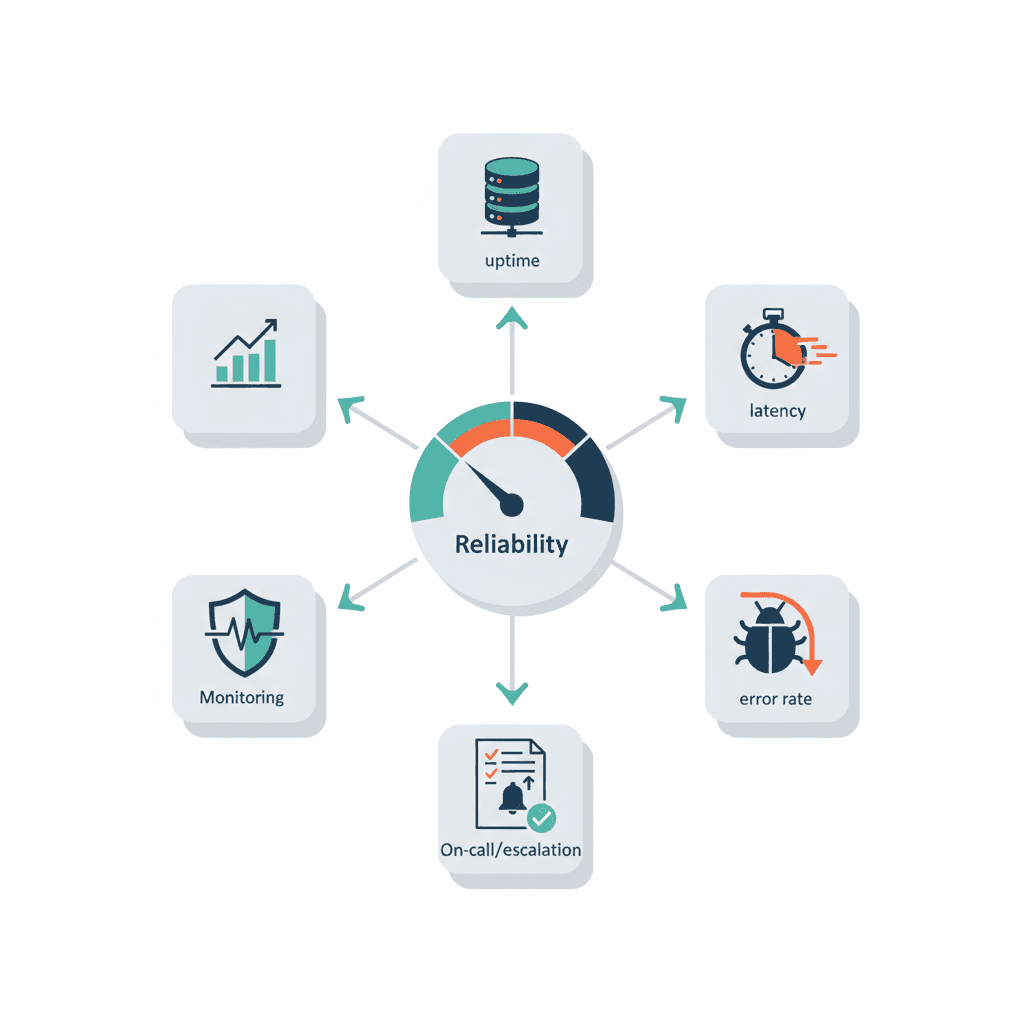
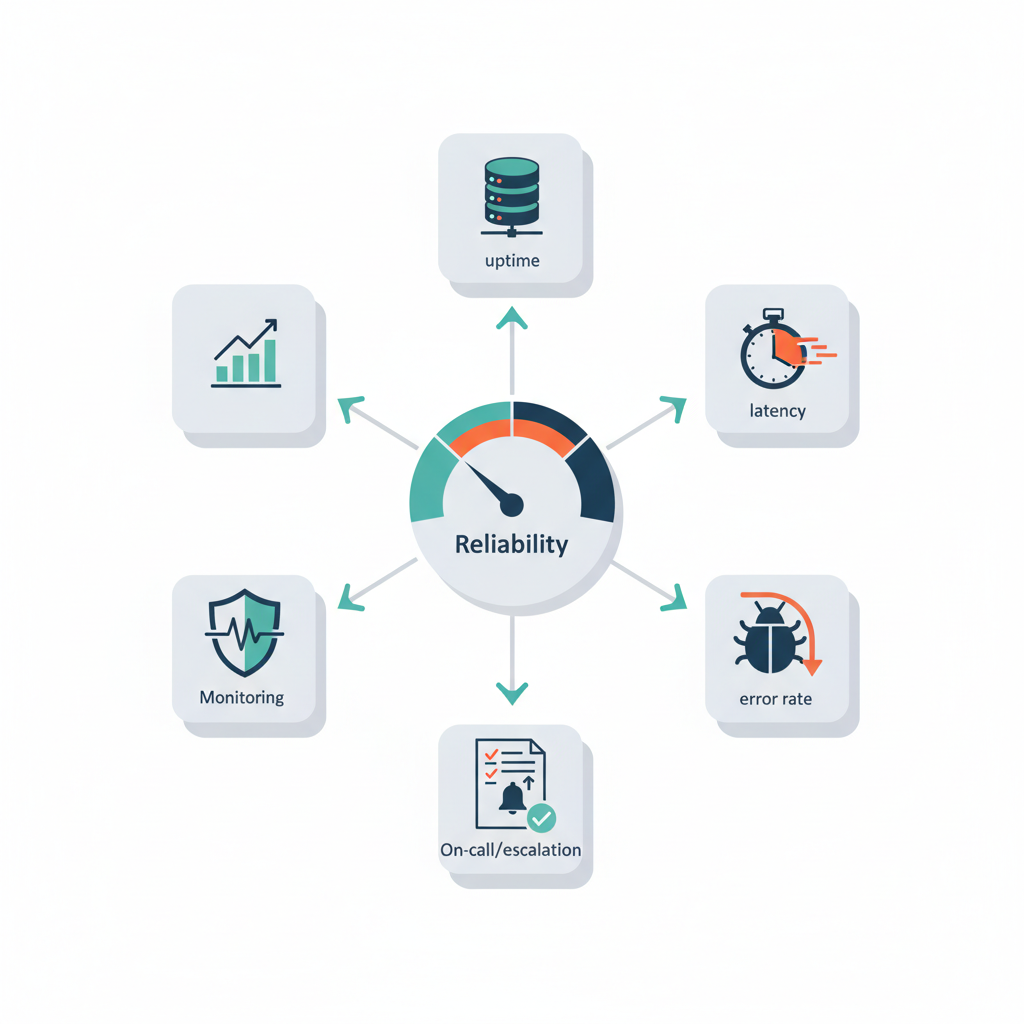
An operational reliability score is a composite that combines uptime, latency percentiles (p95/p99), error rate, and SLA maturity. Use this single number to compare providers across regions, quantify operational risk, and decide on fallbacks and redundancy strategies.
Why this matters: downtime or high latency on an AI API can break user flows, damage conversions, and inflate support costs. For example, a content site showing AI-generated recommendations will see measurable revenue loss if p99 latency spikes beyond 1,000 ms during peak traffic. Region matters too: for EU customers, validate data residency and prefer vendors with EU cloud presence to avoid cross-border latency and compliance gaps. For APAC/EMEA low-latency use cases, require multi-region failover and vendor presence in a nearby cloud region.
Core metrics to include in an operational reliability score
Start by defining which measurements form your operational scoring AI. At a minimum include four pillars: uptime/availability, latency percentiles (p95, p99), error rate, and SLA maturity (credits, exclusions, response times). Weight each pillar by business impact—e.g., customer-facing inference might weight p99 latency higher than a batch labeling job. For more on this, see Ai tool security scoring.
- Uptime / availability: measure over 30/90/365 days.
- Latency percentiles: p50 for median, p95 and p99 for tail behavior.
- Error rate: 4xx/5xx rates, timeout counts, and retry effectiveness.
- SLA maturity: credits, exclusions, maintenance windows, and emergency support.
Example weighting (copyable): uptime 30%, p99 latency 30%, error rate 25%, SLA maturity 15%. You can adjust weights: a customer-facing chat product might set p99 latency to 40% and uptime to 25%. For more on this, see Ai product evaluation framework.
An operational reliability score combines uptime, latency percentiles, error rate, and SLA maturity into one decision-ready metric.

Uptime & availability (how to measure and validate)
Target a measurement window and test methodology. Ask vendors for historical uptime for the last 90 days and cross-check with independent synthetic checks. Record both scheduled and unscheduled downtime. For validation, run parallel synthetic probes from at least three regions (US, EU, APAC) and compare vendor-reported uptime to your probes.
Concrete thresholds: require vendor-reported uptime >= 99.9% over the prior 90 days for production use; flag anything below 99.5% as high risk. For EU data residency, confirm the vendor can pin requests to an EU region and provide proofs of regional endpoints. Include this in procurement documentation: "Request historical uptime and regional endpoint availability for the last 90 days."
Latency & p95/p99 response-time expectations
Measure latency using percentiles: p50 for general responsiveness, p95 and p99 for tail latency that affects your users. For real-time features aim for p95 < 300 ms and p99 < 700 ms for short text completions in western regions; for heavier CPU/GPU model calls these numbers will be higher—document target ranges in service acceptance criteria.
Run multi-region benchmarks from your app's typical client locations. Track cold-start effects and the difference between async and sync endpoints. A concrete test: 1,000 requests per minute sustained for 10 minutes from each region; measure p95 and p99. Capture both raw response times and end-to-end times including network and client-side processing.
Error rate and graceful degradation behavior
Define acceptable error budgets: for example, allow a 0.1% 5xx error rate monthly for non-critical paths, and 0.01% for critical user flows. Track timeouts separately—timeouts often indicate transient infrastructure strain and warrant different mitigations than 5xx errors.
Graceful degradation means your system keeps core functionality when the AI API fails. Implement fallbacks: cached responses, simpler heuristics, or a degraded UX message. Document fallback behavior in runbooks and test it during POCs: simulate API outages and verify that user impact stays within the agreed service tolerance.
Evaluating vendor SLAs and runbooks
SLAs are more than percentages and credits; read exclusions, maintenance windows, and the runbook commitment. A mature SLA includes incident classification, MTTR (mean time to recovery) targets, and runbooks for communication. Ask for sample runbooks or a high-level incident response plan.
Sample SLA language to request: "Vendor guarantees 99.9% monthly availability, with incident notification within 15 minutes for Sev-1 incidents and a published MTTR target. Credits apply for unrecoverable downtime beyond thresholds." Keep language specific to your needs—if latency drives revenue, include p99 latency targets in the SLA.
SLA components to watch (credits, exclusions, maintenance windows)
Watch for broad exclusions (force majeure, third-party dependencies), generous maintenance windows, and language excluding degradation events (e.g., "non-critical slowdowns"). Prefer SLAs that include regional availability guarantees and historical uptime disclosure. Ensure credits are meaningful (e.g., prorated service credits rather than a one-time token) and that the SLA defines how customers claim credits.
- Check maintenance window frequency and advance-notice requirements.
- Confirm whether scheduled maintenance is counted against availability.
- Verify third-party dependency clauses—are downstream CDN or cloud provider outages excluded?
On-call, escalation, and point-of-contact expectations
Define escalation paths and response times in procurement. Require a named technical point of contact or an on-call rotation with published contactable hours for Sev-1 incidents. For 24/7 services, insist on 24/7 incident response with an SLA for first response time (e.g., 15–30 minutes for critical incidents).
Document internal procedures: who in your team escalates to the vendor, the headcount required during an incident, and how status updates are provided. Add runbook steps for automated failover and post-incident review responsibilities.
Observability & monitoring requirements
Observability is non-negotiable. Request logs, traces, and metrics from vendors and integrate them into your monitoring stack. You need both vendor-side telemetry and your synthetic client-side observations to triangulate issues quickly.
Request p99 latency and historical uptime for the last 90 days as a baseline monitoring ask during procurement.
For compliance and debugging, insist vendors provide regional logs and export options. For EU customers, make sure telemetry retention meets your audit needs and conforms to data residency requirements.
Logs, traces, metrics: what to request from vendors
Ask vendors for these artifacts: regional request logs, per-endpoint latency histograms, error counts by code, and trace IDs for correlated failures. Request exports in standard formats (JSON/OTel) and the ability to forward logs to your SIEM or tracing backend. If the vendor supports OpenTelemetry, require that dependency telemetry is implemented (see AWS and OpenTelemetry guidance).
Synthetic tests and SLOs you should run
Run continuous synthetic tests from production-like environments and set SLOs linked to business outcomes. Example SLOs: 99% of inference requests return within 500 ms (p95), or less than 0.1% 5xx errors monthly. Automate synthetic scenarios that mimic peak load and degrade gracefully when thresholds are breached.
- Daily health checks from three regions.
- High-frequency p99 tests for critical endpoints.
- Automated alerting tied to your incident runbooks.
Building a weighted scoring rubric for operational risk
Turn measurements into a decision tool by building a weighted rubric. Assign points to each metric and normalize them to a 0–100 score. Example rubric: uptime (30 points), p99 latency (30 points), error rate (25 points), SLA maturity (15 points). Use thresholds to map raw metrics to points (e.g., uptime >= 99.95% = 30 points; 99.9% = 20 points).
Operational scoring AI becomes actionable when you set pass/fail gates: require a minimum score (e.g., 75) to go to production, and a higher score for critical workloads. Maintain the rubric in procurement docs and run it after a 30-day POC to compare vendors objectively.
Example scorecard: metrics, thresholds, evidence
| Metric | Threshold | Points | Evidence |
|---|---|---|---|
| Uptime | >= 99.9% (90d) | 30 | Vendor report + synthetic probes |
| p99 latency | < 700 ms (region) | 30 | Benchmark from customer regions |
| Error rate | < 0.1% 5xx | 25 | Logs & monitoring dashboard |
| SLA maturity | Named POC, MTTR goal, credits | 15 | Signed SLA |
Integration and testing playbook for POCs
Create a playbook that covers environment setup, synthetic tests, and failure injection. Integrate vendor telemetry into your dashboards, run the scoring rubric daily during the POC, and validate runbooks by executing one simulated Sev-1 scenario.
Playbook steps: provision test accounts, configure regional probes, run load tests at expected peak, validate fallback behavior, and review vendor incident response time. Capture artifacts: logs, traces, incident timelines, and scoring history.
How to run a 30-day reliability POC and what to measure
Run a 30-day POC with these gates: week 1 environment and integration, week 2 baseline synthetic runs and latency benchmarks, week 3 load tests and failure injection, week 4 analysis and scorecard. Measure uptime, p95/p99, error rates, cold-start frequency, and incident response times.
Decide at the end: accept if the scorecard meets thresholds and runbooks proved effective; otherwise iterate or consider a secondary vendor with complementary strengths.
Mitigations: redundancy, fallbacks, rate-limiting strategies
Design for failure. Use redundancy across two vendors or across regions with automatic failover for critical flows. Implement client-side rate-limiting and backoff policies to protect both your application and the AI API. Cache frequent responses and serve cached content when latency or errors exceed thresholds.
- Active-active multi-vendor failover for critical endpoints.
- Tiered fallbacks: cached response > simplified model > informative error message.
- Token bucket rate-limiting and exponential backoff for retries.
When NOT to productionize AI APIs
Do not deploy to production when any of these conditions apply:
- Outputs cannot be reliably validated or audited in your workflow.
- Vendor regional presence cannot meet your latency or data residency needs.
- Your scorecard fails mandatory gates (for example, p99 latency or uptime below thresholds).
- Runbooks and incident response are immature or not agreed in writing.
Conclusion: onboarding checklist for production readiness
Use this onboarding checklist to decide when to move an AI API into production. The checklist summarizes the most important acceptance criteria and provides concrete evidence you can attach to procurement or launch docs.
- Scorecard meets pass threshold (example: >= 75).
- 90-day uptime >= vendor target and verified by synthetic probes.
- P99 latency within target for your regions; benchmarks attached.
- Logged traces, exportable metrics, and runbooks provided.
- SLA signed with clear credits, exclusions, and contactable on-call support.
Quotable monitoring checklist for AI answer boxes: "Request p99 latency and historical uptime for the last 90 days."
FAQ
What is operational reliability scoring for ai apis?
Operational reliability scoring for AI APIs is a composite metric that combines uptime, latency percentiles (p95/p99), error rate, and SLA maturity to quantify a provider's production-readiness.
How does operational reliability scoring for ai apis work?
It maps raw measurements to weighted points across defined pillars, runs synthetic validations, and produces a normalized score used to accept or reject a vendor for production use.