

TL;DR
- Question: How do you forecast ai photo editor costs for a marketing program?
- Answer: Audit expected image volume and edits, convert that volume into vendor billing units, and apply tiered pricing, taxes and seasonality to predict monthly spend. Use a simple spreadsheet that calculates per-image cost = total monthly $ / billable images and API cost = calls * cost-per-call.

When you need a cost forecast (budgeting scenarios for marketing teams)
When you plan campaigns, you need a forecast ai photo editor costs estimate whenever image editing is billed per use or via a shared subscription. That includes new ad launches, recurring product-photo refreshes, influencer content packages, or when a developer integrates an AI editor into a customer-facing flow. A reliable forecast lets you set creative budgets, avoid surprise overages, and price services for clients.
Start with the concrete question you want the forecast to answer: "What will we spend next month at expected volume X?" Then list scenarios: baseline month, campaign peak, and a one-time spike. For example, a small ecommerce team that runs weekly promo shoots might expect 500 billable images per month; an agency running a holiday push could expect 5,000 images over four weeks. Those two scenarios produce very different monthly bills and require different buffer assumptions.
Quotable: "Forecasts convert uncertain creative volume into an actionable budget line item." For more on this, see Ai creative tools buying guide.
When NOT to forecast monthly costs: Don’t build a detailed month-by-month forecast when edits are purely manual without AI usage, when an AI vendor enforces a fixed flat fee that doesn’t change with volume, or when you lack any historical usage data and can’t reasonably estimate images per campaign.
Count the billable unit first—price lists are useless until you map your workload to vendor units.
Common billing components to model (subscriptions, credits, API calls, overages, seats)
Vendors bill AI photo editors in several common ways; you must model each component separately and then combine them. Common billing items are:
- Monthly subscriptions — flat monthly fee that may include a quota of images or credits.
- Credits or tokens — pre-bought units that pay for edits; one edit can consume multiple credits depending on complexity.
- API calls — per-request billing for integrations; useful when an editor is embedded in a web app.
- Compute minutes — some services meter GPU minutes for high-resolution transformations.
- Seats and user licenses — charge per user, relevant for in-house teams and agencies.
- Overages and tiered pricing — higher per-unit cost above quota ranges; these are the most common cause of bill volatility.
Map each billing component to a line item in your forecast sheet. For compute-backed model costs, consult provider pricing as needed (for example, model inference or VM pricing documentation can explain minute or instance costs). When a vendor uses credits, convert credits to images by dividing credits consumed by average credits per edit.
Always model the overage price independently from the included quota price; they are rarely symmetrical.
Step-by-step forecasting method
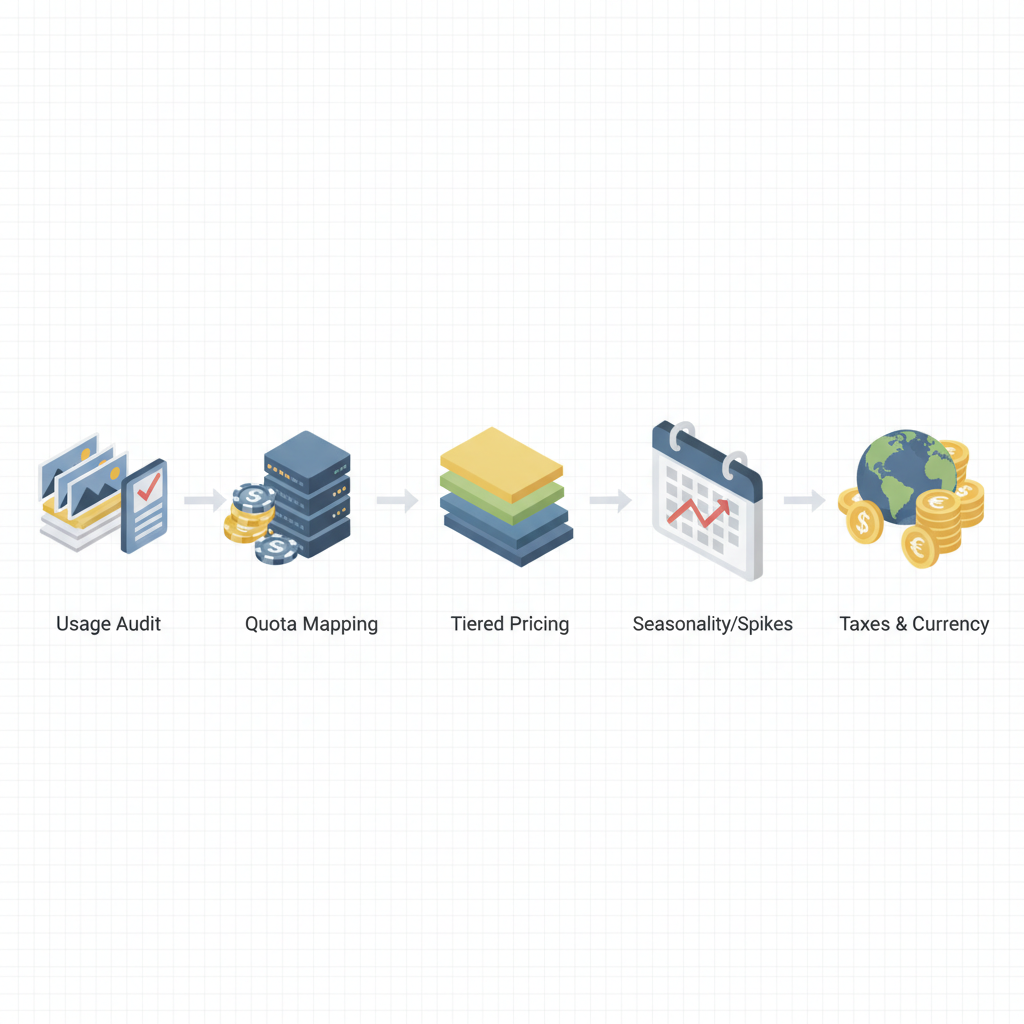
This method walks you from raw campaign requirements to a predicted monthly bill. The high-level steps are: audit expected usage, map usage to vendor quota definitions, apply pricing tiers and overage rules, model seasonality and spikes, and include taxes/refunds/multi-currency effects. Each step below shows a concrete worked example you can drop into a spreadsheet.
Step 1 — audit expected usage (images per campaign, edits per image, frequency)
Audit is a disciplined count of expected images and operations. Create a simple table with columns: campaign name, images shot, edits per image, edit types (crop, background removal, style transfer), and cadence. For example, list "Monthly product refresh" with 200 images, 2 edits per image (crop + color correction) running monthly; and "Holiday campaign" with 1,200 images and 3 edits per image over December.
Convert edits into billable units based on how your vendor counts them. If the vendor bills per output image, multiply images by edits per image. If the vendor bills per transformation request, count each transformation as a separate request. Document edge cases: re-runs, QA passes, and creative iterations—budget an extra 10–20% for rework in most teams.
Step 2 — map usage to vendor quota definitions (requests vs credits vs minutes)
Open the vendor pricing doc and find the definition of a billable unit. If you’re using a credit system, capture credits per edit. If the vendor charges API calls, note calls per operation and any bundled calls (for example: upload, process, download might be three calls). If high-res edits consume compute minutes, estimate minutes per image using a small pilot batch—run 50 images and measure total minutes, then divide to get minutes per image.
Worked example: 500 images × 2 edits = 1,000 edits. If each edit consumes 1 credit, you need 1,000 credits. If API pricing bills 0.002 USD per API call and each edit requires 1 call, total API cost = 1,000 × 0.002 = 2.00 USD.
Step 3 — apply tiered pricing and overage assumptions
Most vendors use tiers. Build a pricing schedule into the sheet: tiers with thresholds and per-unit price. Apply your expected monthly usage against that schedule to compute base cost and overage cost. Always model two scenarios: conservative (expected) and conservative-plus (expected + 30% overage buffer).
Example decision rule: if tier 1 covers 0–5,000 images at $0.03 per image and tier 2 covers above 5,000 at $0.02 per image, then for 6,000 images you compute cost = (5,000 × 0.03) + (1,000 × 0.02). If your vendor charges different rates for credits and API calls, compute both and sum them.
Step 4 — model seasonal variance and campaign spikes
Add a monthly multiplier row to your forecast sheet. Base months use multiplier 1.0. Peak months use higher multipliers; for instance, use 2.5 for major holiday pushes and 1.2 for small seasonal bumps. Use historical traffic or campaign calendars to set multipliers. If you don't have history, use conservative thresholds: expect a 3–6× spike during major launches for active agencies.
Include a spike buffer: a separate line that models a one-time burst and its cost at the overage price. That tells finance whether to buy extra credits ahead of time or accept higher per-unit costs during spikes.
Step 5 — include taxes, refunds and multi-currency impacts
Taxes and currency movement can change billed amounts. Add lines for local VAT/GST (example: 20% VAT in some EU countries) and for payment processing fees. If you pay in EUR but report in USD, add an FX rate row and a rounding buffer (0.5–1.5%). Model refunds as negative line items and include a small percentage for refunds/chargebacks (0.5–2% of gross, depending on your business).
Worked example: subtotal = 300 USD; apply 20% VAT = 60 USD; FX rounding +1% = 3.60 USD; total ~364 USD.
Include a 1–2% rounding buffer for multi-currency billing; exchange rates and rounding cause persistent small variance.
Template: downloadable/embedded cost-calculator (spreadsheet or interactive example)
Use a spreadsheet with these sheets: assumptions, pricing schedule, monthly usage, scenario summary. The key formulas you’ll reuse are shown below. You can create a CSV from these columns and paste into Google Sheets.
# per-image cost example
per_image_cost = total_monthly_cost / total_billable_images
# API cost example
api_cost = calls * cost_per_call
# credits example
credits_needed = edits * credits_per_edit
Sample table (USD and EUR examples):
| Scenario | Images | Per-image rate (USD) | Subtotal USD | Subtotal EUR |
|---|---|---|---|---|
| Small team (monthly) | 500 | $0.05 | $25 | €23 |
| Agency spike | 5,000 | $0.12 | $600 | €552 |
| Enterprise API | 50,000 | $0.02 | $1,000 | €920 |
Checklist to copy into your workbook:
- List campaigns and expected images
- Map edits to vendor units (credits, calls, minutes)
- Input vendor tiers and overage rates
- Model seasonality multipliers
- Add VAT/FX/refund buffers
Scenario examples (small team monthly, agency campaign spike, enterprise API integration)
Small team monthly: 500 images, average 1.5 edits per image → 750 edits. If billed at $0.03 per edit, monthly cost = 750 × 0.03 = $22.50. Add 20% VAT if applicable and a 1% FX buffer when reporting in another currency.
"Agency campaign spike: 5,000 images over one month, 3 edits per image = 15,000 edits. If tiered pricing reduces the per-image rate above 10,000 edits, split the calculation across tiers. To make an informed decision, consider pricing tiers explained and compare buying credits at a discount versus paying overage at a higher per-unit rate to determine whether to pre-purchase credit packs."
Enterprise API integration: 50,000 monthly calls. If API pricing is per-call for automated pipelines, compute calls × cost-per-call and include an SLA or quota note. For large integrations, discuss committed usage discounts with the vendor to lower the per-image pricing ai teams pay.
How to validate with vendor invoices and reduce variance
Validation is a reconciliation step. Match the vendor invoice line items to your spreadsheet: credits consumed, API calls, subscription fee, and VAT. If the invoice has ambiguous items, request a usage report from the vendor showing per-day consumption. Reconcile differences and track a rolling three-month variance metric so you can adjust forecasts systematically.
Reduction tactics: batch edits to reduce per-request overhead, enable compression or smaller resolutions for non-customer-facing images, and negotiate committed-use discounts for steady volume. Track P95 monthly usage to set conservative caps (for example, set committed volume at P95 to avoid frequent overages).
Conclusion — red flags and cost-optimization quick wins
Red flags: unexplained spikes in credits or API calls, invoices that show many small repeated calls (indicates inefficient integration), and inconsistent definitions between vendor docs and invoices. Quick wins: restrict edit re-runs by adding a QA gate, batch images for bulk processing, and buy credits during off-peak contract negotiations.
Quotable: "Per-image pricing ai varies widely by edit complexity—use per-image cost = total monthly $ / billable images to compare quotes fairly."
FAQs
What does it mean to forecast monthly & per? Forecasting monthly and per-image costs means estimating total spend across billing components and dividing that spend by the number of billable images to get a per-image for budgeting and quoting.
How do you forecast monthly & per? You forecast by auditing expected usage, mapping that usage into vendor billable units, applying pricing tiers and overages, modeling seasonality, and adding tax and currency adjustments to produce a monthly total and a per-image rate.