

TL;DR
- Question: How do you measure ai video creation roi small team? Answer: Calculate all direct and indirect costs, quantify time and engagement gains, then apply a net-benefit ROI formula and a payback calculation to decide whether to pilot or buy.
- Quick example: "A 5-person marketing team can break even in X weeks when automation reduces edit time by Y%" (replace X/Y with your inputs).

Why ROI matters when picking an AI video creation tool
If you run a small content team, every hour and every subscription dollar matters. Measuring ai video creation roi small team clarifies whether a tool actually replaces expensive human labor, increases output, or simply adds recurring cost. You should care because a poor choice multiplies monthly spend and creates hidden review overhead; a good choice shortens time-to-publish and increases engagement without bloating headcount.
Start by asking two operational questions: how much time does your team spend producing one video today, and what value (views, leads, sales) does each published video deliver? Those two anchors let you convert productivity gains into an economic benefit. Practical example: if an editor currently spends 6 hours per video and an AI tool trims that to 2 hours, you’ve freed 4 billable hours per video that can be redeployed to new content or other tasks.
When not to adopt AI video creation tools: For more on this, see Ai video creation tools 2026.
- Your content requires complex, domain-specific legal review that AI cannot reliably handle;
- You lack any way to measure upstream or downstream value (no analytics on views, leads, or conversions);
- Your team produces fewer than one video per month and the subscription cost exceeds expected productivity gains.
Quick definitions — what counts as costs, savings and benefits
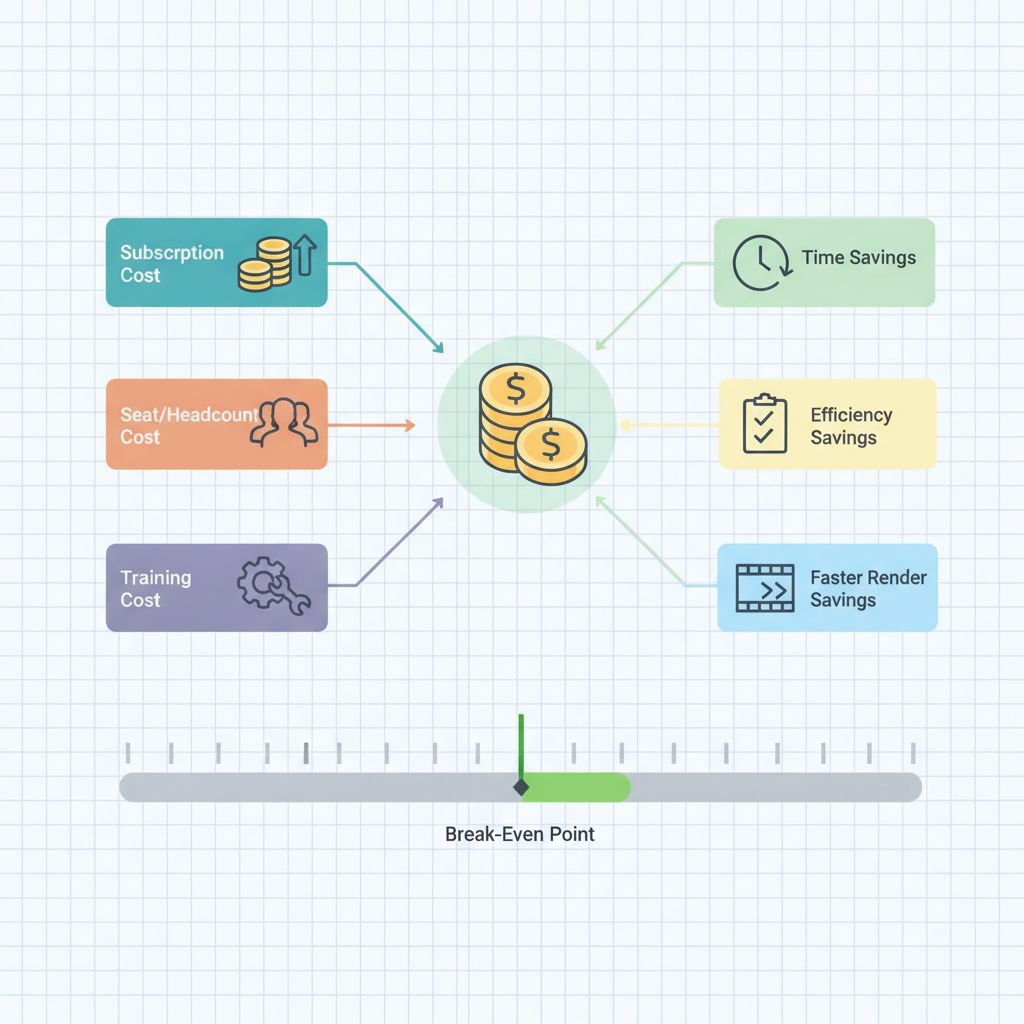
Define terms before you calculate: costs include subscriptions, per-minute rendering/usage fees, and seat licenses; indirect costs include training, integration, and additional review. Savings are time saved from editing, scripting, or localization. Benefits are monetized outcomes such as leads, sales, or the opportunity cost of redeployed staff time. Use region-agnostic formulas so the worksheet works across jurisdictions.
Practical note on US vs EU billing: many US-focused tools offer flat monthly plans, while some EU-targeted or enterprise offerings charge per-minute or per-render usage. When comparing, normalize to monthly equivalents (e.g., monthly subscription + average usage minutes × per-minute fee). Also account for VAT differences and data residency constraints in the EU when evaluating enterprise plans. For more on this, see Ai creative tools buying guide.
Quotable definition: "AI video creation tools are software that automates scripting, editing, and rendering steps to reduce human time per video while maintaining publishable quality." Use that to anchor your worksheet categories.
Calculate ROI by converting time saved into billable hours or additional output—those are your most reliable savings metrics.
Direct costs (subscription, usage fees, seat costs)
Direct costs are straightforward to list and sum. Include: monthly subscription fees, per-minute rendering or processing charges, additional seat licenses for editors or reviewers, and any premium feature add-ons you plan to use (e.g., cloud encoding, HD outputs). When vendors offer tiered pricing, estimate your steady-state usage, not just launch-month spikes.
Example: compute a monthly direct-cost line by listing each active seat × seat price, plus expected minutes processed × per-minute fee, plus add-ons. If a tool charges $30/user/month and you assign two seats, that's $60. If you expect 500 render minutes at $0.05/minute, add $25. Tally these into your monthly direct-cost cell.
Indirect costs (training, integration, review time)
Indirect costs often conceal the true expense of adopting new tools. Account for initial training hours (multiply hours × average hourly cost of attendees), time for integrating exports into your CMS or video hosting workflow, and the extra review cycles required until AI outputs meet your quality bar. Also include incidentals like template design or brand kit setup.
Example items to log: 8 hours of editor training (8 × editor hourly rate), 10 hours of developer time to wire webhooks to your CMS, and an average of 45 minutes extra review per video for the first two months. These figures convert into a one-time implementation cost and a transient monthly overhead you can amortize across months in the worksheet.
Core ROI formula and variations for small teams
Use a simple, auditable core formula and two practical variations for small teams. Core formula: Net benefit divided by total cost. Variations help when benefits are non-monetary (time saved) or when you want a break-even timescale.
Core formula (region-agnostic):
Net benefit = (Monetary value of output gained + Monetized time savings) − (Direct costs + Allocated indirect costs).
Variation 1 converts time savings into labor cost saved (hours saved × hourly rate). Variation 2 is output-driven: monetized incremental leads or revenue per video × additional videos produced because of automation.
Net benefit must include redeployed staff value or the revenue from extra content — otherwise ROI understates impact.
Simple ROI: (Net Benefit / Cost) × 100
Apply the simple ROI to your monthly totals. If monthly net benefit is $1,200 and monthly cost is $400, ROI = (1200 / 400) × 100 = 300%. For a small team, this number tells you whether the tool pays for itself within your planning horizon.
Two practical examples: 1) If automation reduces per-video edit time by Y% and you produce N videos monthly, calculate hours freed = (old hours − new hours) × N. Multiply by your average hourly cost to monetize time saved. 2) If engagement lift increases leads per video from L1 to L2, monetize additional leads by average deal size × conversion rate to estimate revenue uplift.
Payback period and break-even calculation
Payback period answers: how long until cumulative benefits equal cumulative costs. Compute cumulative monthly net benefit and divide the initial implementation + first-month costs by monthly net benefit. If your one-time implementation cost is $2,000 and monthly net benefit is $500, payback = 4 months. For subscription-heavy tools, include the first three months' subscription in the numerator if you expect ramp-up time.
Decision rule: prefer pilots whose payback period is under 6 months for small teams producing regular content; extend to 9–12 months if the tool unlocks strategic capabilities (localization, scale to new markets) that don't convert immediately.
KPI set for small content teams (templates you can copy)
Pick 4–6 KPIs that map back to the ROI worksheet. Make them measurable and time-bound. Example KPI template you can copy:
- Time-to-publish: median hours from brief to live per video (target: reduce by X%).
- Cost-per-video: (direct + allocated indirect costs) / videos published.
- Engagement lift: percent change in view-through rate, watch time, or CTR vs baseline.
- Repurposing yield: number of social clips produced per long-form video.
These KPIs tie directly into the ROI spreadsheet: time-to-publish converts to hours saved, cost-per-video feeds the denominator, and engagement lift converts to monetized benefit via conversion assumptions.
Time-to-publish, cost-per-video, engagement lift, repurposing yield
Time-to-publish matters because shorter cycles mean you can iterate faster and test more creative ideas. Cost-per-video is the clear cost-side metric; track it weekly for the first 90 days. Engagement lift requires baseline analytics — compare the same content type before and after tool adoption. Repurposing yield measures the incremental content you can produce without increasing headcount.
Template KPI thresholds (example placeholders you should replace with your data): aim to reduce time-to-publish by 30%, lower cost-per-video by 20%, and increase engagement metrics (watch time or CTR) by 10% to justify most subscriptions for small teams.
Step-by-step worksheet: how to populate the numbers (with example)
Follow these steps to populate your ROI worksheet. 1) Record baseline: hours per video, monthly videos, current cost-per-video. 2) Estimate post-adoption values: expected hours per video, additional videos per month enabled, anticipated engagement lift. 3) List direct and indirect costs and amortize one-time costs over a chosen payback window. 4) Compute net benefit, ROI, and payback period.
Use conditional cells: keep conservative and optimistic columns to run sensitivity checks (lower/higher engagement lift, higher usage fees). This gives you a realistic range instead of a single point estimate.
Example: 1 video/week for a 5-person team — inputs and outputs
Example (replace with your numbers): baseline production = 1 video/week (4.3/month). Baseline editor time = 6 hours/video. With AI tool, editor time drops to 2 hours/video (Y% reduction placeholder). Hours saved per month = (6 − 2) × 4.3 = 17.2 hours. Monetize hours saved at your average loaded hourly rate to compute monthly labor savings. Add incremental benefit from producing one extra short-form clip per week and any uplift in engagement.
Run the numbers into the core ROI formula, and you’ll see a monthly net benefit and payback period. Keep the quotable example handy: "A 5-person marketing team can break even in X weeks when automation reduces edit time by Y%" — substitute your inputs to make the statement actionable for stakeholders.
Sensitivity checks and risk factors (usage spikes, licensing, quality delta)
Sensitivity checks test how ROI changes when key inputs move. Vary per-minute usage by ±30%, engagement lift by ±50%, and training hours by ±25% to see worst-case and best-case scenarios. Key risks: unexpected per-minute spikes during campaigns, license ramp restrictions, and a quality delta that increases review time rather than reducing it.
Mitigations: cap monthly usage on the vendor dashboard during pilots, negotiate roll-over minutes or overage discounts, and set a strict quality gate for publishing AI-generated outputs for the first 60 days.
Decision rules: when to pilot vs. buy enterprise
Decision rule heuristic for small teams: pilot if expected payback ≤ 6–9 months and annualized ROI is positive under conservative assumptions. Prefer enterprise only when you need SSO, data residency, or committed volume discounts that change the unit economics materially. Pilots should be time-boxed (60–90 days) with clear KPI checkpoints: reduction in time-to-publish, stable or improved engagement, and predictable per-minute spend.
Example decision matrix (qualitative): pilot when you lack analytics or need to validate quality; buy enterprise if monthly usage > X minutes (replace with your threshold) and data residency or SLA requirements exist.
Downloadable worksheet & next steps (pilot checklist)
Use the checklist and table below as reusable artifacts you can copy into a spreadsheet and adapt to your team.
Pilot checklist
- Assign a pilot owner and two reviewers.
- Record baseline metrics for 30 days before pilot.
- Set pilot duration (60–90 days) and KPI targets.
- Cap usage and monitor per-minute costs weekly.
- Review outputs against quality gate and collect reviewer time data.
Before / After comparison table
| Metric | Baseline | Projected (post-AI) |
|---|---|---|
| Hours per video | 6 | 2 (replace) |
| Videos per month | 4 | 6 (replace) |
| Cost-per-video | $X | $Y (replace) |
| Engagement (views) | V1 | V2 (replace) |
Conclusion — three quick questions to decide next actions
Answer these to decide: 1) Can you measure baseline time and engagement accurately? 2) Does the projected monthly labor savings exceed monthly direct costs under conservative assumptions? 3) Is the payback period within your acceptable planning window (typically 6–9 months)? If yes to all three, run a 60–90 day pilot with the checklist above.
FAQ
What does it mean to calculate roi for ai video creation tools?
Calculating roi for ai video creation tools means quantifying all costs (direct and indirect), monetizing time savings and content-driven benefits, then applying a clear ROI formula to measure net benefit over cost for your small team.
How do you calculate roi for ai video creation tools?
You calculate ROI by recording baseline metrics, estimating post-adoption savings and benefits, summing direct and allocated indirect costs, and applying the formula ROI = (Net benefit / Total cost) × 100, while also computing payback period and running sensitivity analyses.
References
- Measure the return on investment (ROI) and business value of AI agents - Microsoft Copilot Studio
- Maximize ROI from AI - Microsoft Azure
- The five-layer AI measurement framework - McKinsey
- AI ROI: The paradox of rising investment and elusive returns - Deloitte
- Video in Business Benchmark Report - Vidyard